Chart Pictures, Images and Stock Photos
Browse 1,818,000+ chart stock photos and images available, or search for graph or infographic to find more great stock photos and pictures.
graph
infographic
infographic chart
chart icon
pie chart
flow chart
bar chart
org chart
growth chart
organization chart
eye chart
stock chart
line chart
medical chart
gantt chart
organizational chart
comparison chart
data chart
chart vector
business chart
3d chart
finance chart
height chart
process chart
organisation chart
flip chart
patient chart
arrow chart
donut chart
sales chart
Most popular
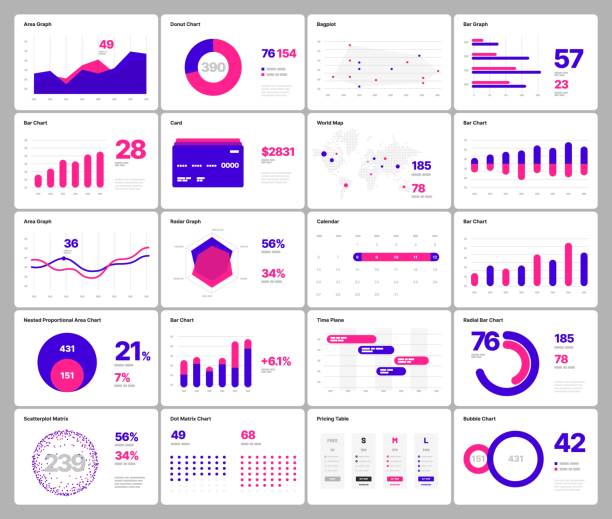
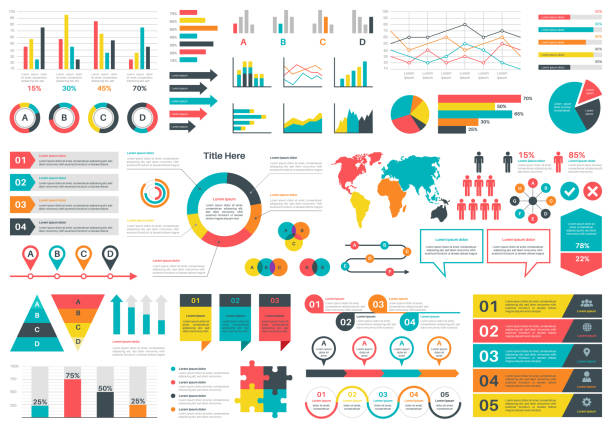
Infographic elements for business layout, presentation template, flyer, leaflet and corporate report. UI and UX Kit with big data visualization.

Infographics charts. Financial analysis data graphs and diagram, marketing statistic workflow modern business presentation elements vector investment progress icon set
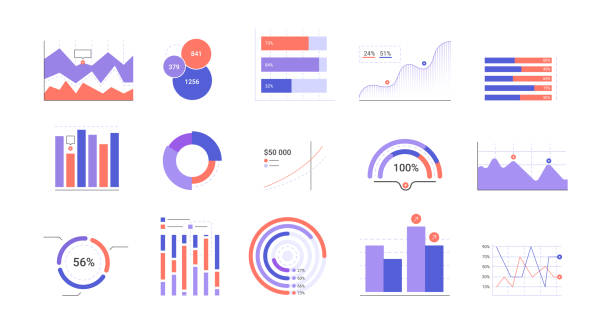
Business data market elements dot bar pie charts diagrams and graphs flat icons set isolated vector illustration.
Simple vector line Icons. Editable stroke. Pixel perfect.
Simple Set of Increase and Decrease Related Vector Line Icons. Contains such Icons as Finance Chart, Abstract Graph, Trend and more. Editable Stroke. 48x48 Pixel Perfect.

financial graph on technology abstract background represent financial crisis,financial meltdown
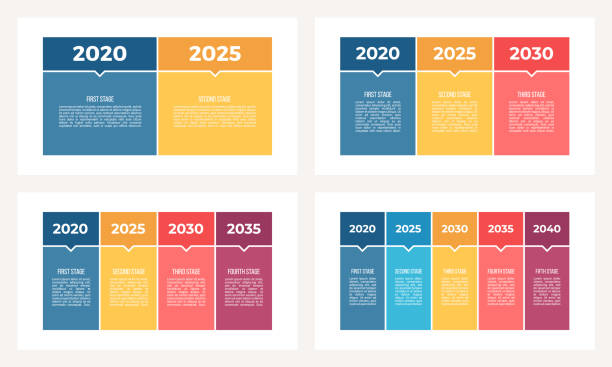
Layout for your options or steps. Abstract template for background.

Stock market changes, forex hologram with numbers and bar chart with candlesticks. Concept of economy and online trading. 3D rendering
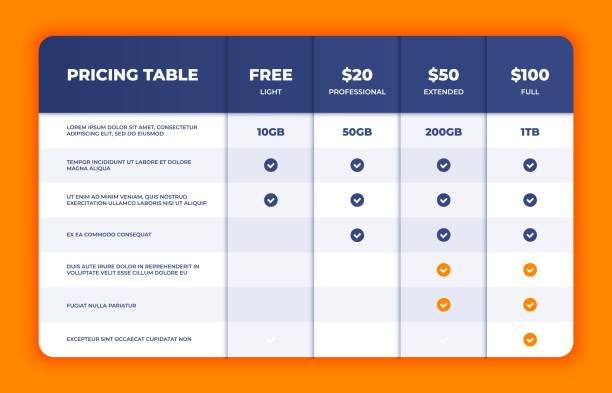
Comparison table. Price chart template, business plan pricing grid, web banner checklist design template. Vector compare price design list

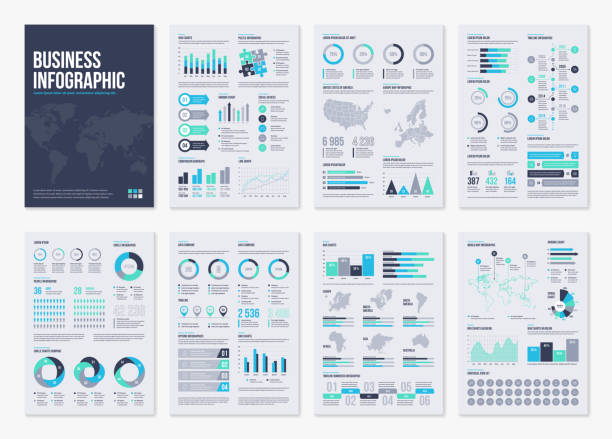
Infographic brochure elements for business data visualization. Vector illustration in modern flat info graphic style.

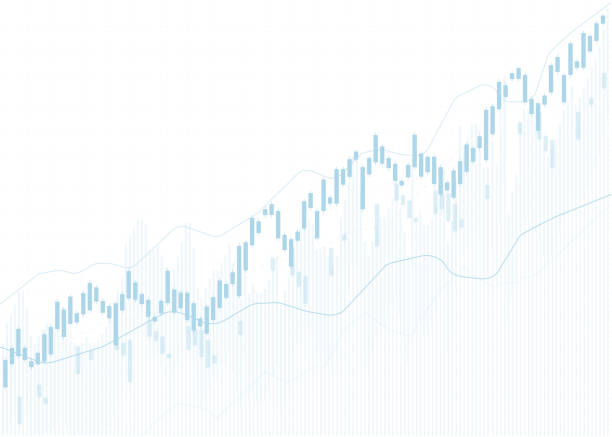
Financial rising graph and chart with lines and numbers that illustrate stock market behaviour. Concept of successful trading. Dark blue background. 3d rendering
Modern infographic template with statistics finance charts. Infographics dashboard. Admin panel interface with color charts, graphs on white background. Illustration flowchart and diagram and workflow

Financial stock market graph. Selective focus. Depicts TradingView financial market chart.

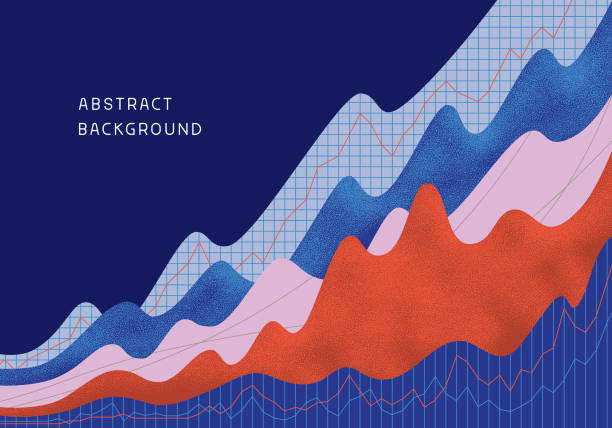
Abstract financial background with uptrend line, textured graphs, charts and copy space. Editable vectors on layers.

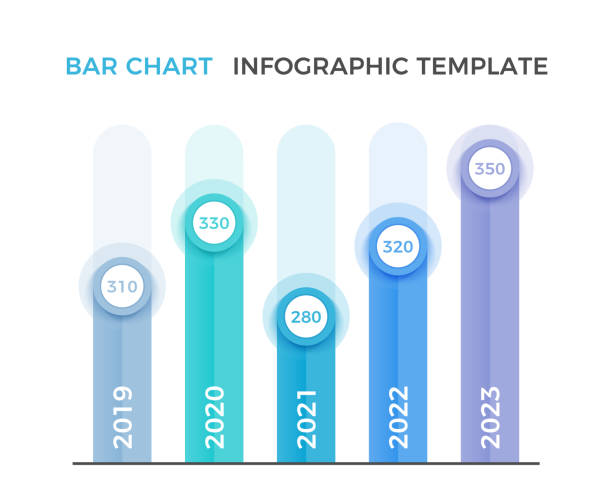
Colorful bar chart template with five elements, business infographics template, vector eps10 illustration

Circle progress bar set with percentage text from 0 to 100 percent. Turquoise blue, light grey. Infographic, web design, user interface. Flat design. Vector illustration, no transparency, no gradients


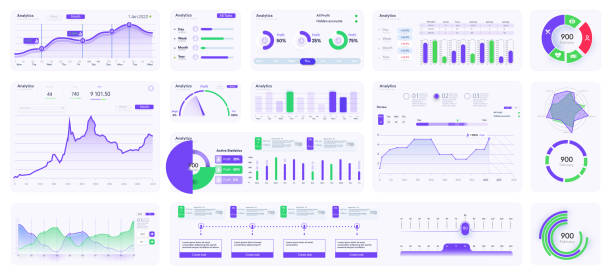
Dashboard, great design for any site purposes. Business infographic template. Vector flat illustration. Big data concept Dashboard
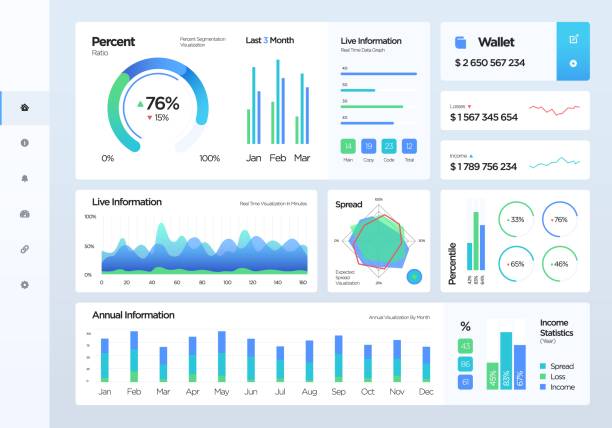
Dashboard infographic template with flat design graphs, charts, UI elements. Admin panel interface. Vector illustration

Financial Business Charts, Graphs And Diagrams. 3D Illustration Render Stock Market Infographics

Financial and investment data concept. Business sales data, progress of business and growth graph plan. Business strategy and corporate development
Vector line icon set appropriate for web and print applications. Designed in 48 x 48 pixel square with 2px editable stroke. Pixel perfect.


Growing graph icon set. Vector illustration. Set of growing bar graph. Business chart with arrow. Growths chart collection. EPS 10.
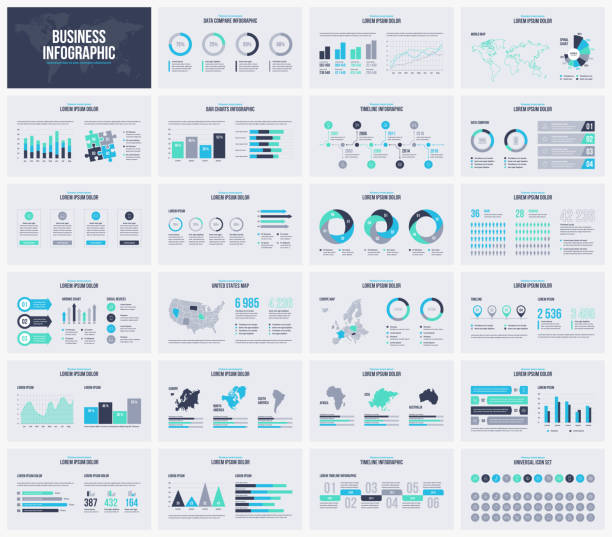
Multipurpose presentation slides vector template. Infographic elements for data visualization with world and USA maps. Set of universal icons.
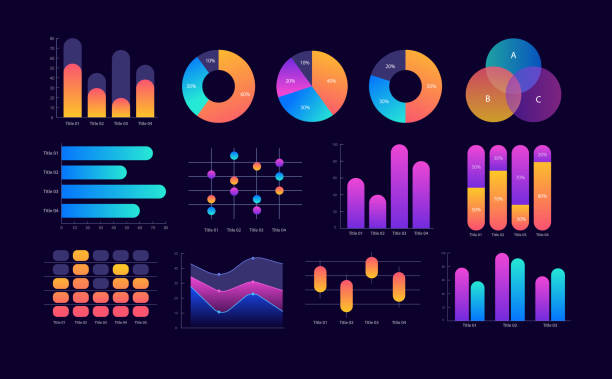
Business statistics and analytics infographic chart design template set for dark theme. Research. Visual data presentation. Bar graphs and circular diagrams collection. Myriad Pro font used

Line graph. Linear chart growth, business diagram graphs and colorful histogram graph or business currency stock financial graphics. Investment planning analysis isolated vector symbols set
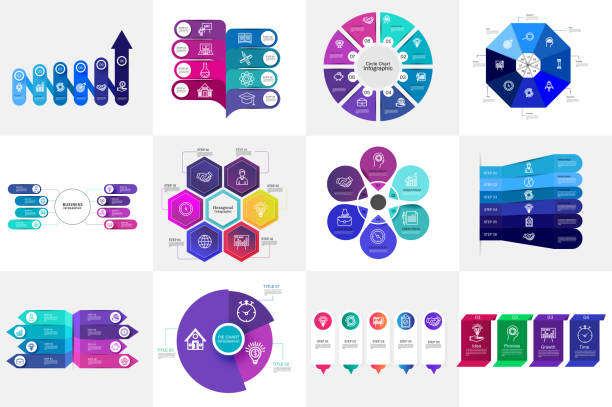
Big collection of colorful infographic. Can be used for workflow layout, diagram, number options, web design. Infographic business concept with options, parts, steps or processes

Financial data analysis graph showing search findings. Selective focus. Horizontal composition with copy space.
Project task management and effective time planning tools. Project development icon. 3d vector illustration. Work organizer, daily plan. Project manager tool, business, productivity online platform
Growth - line vector icon set. 20 icons. Pixel perfect. Editable outline stroke. The set includes a Personal Growth, Revenue Growth, Rocket Launch, Percentage Growth, Presentation, Investment, Mountain Peak, Positive Emotion, Moving Up.
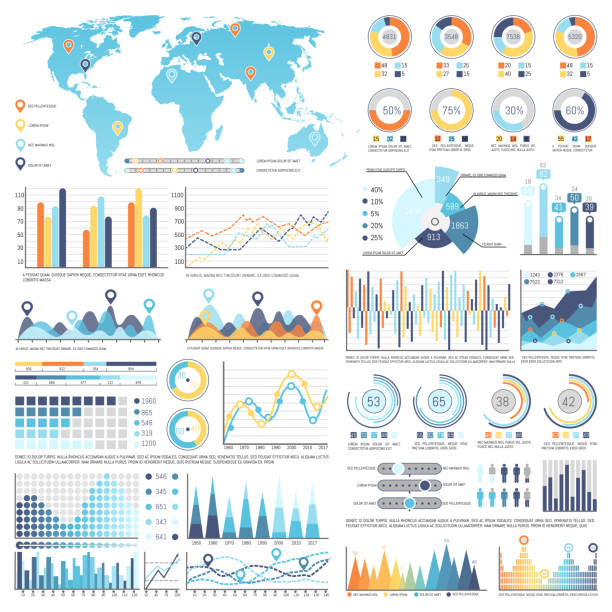
Collection of various types of infographics and charts along with blue template of world map isolated vector illustration on white background


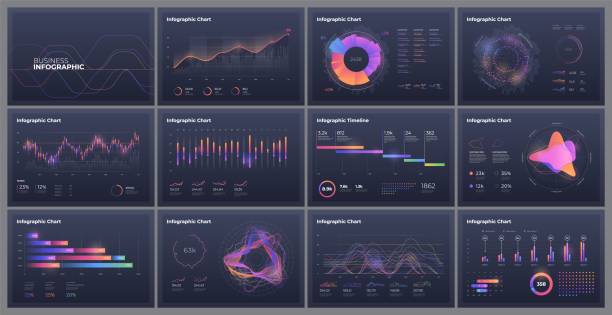
Dashboard infographic template with big data visualization. Pie charts, workflow, web design, UI elements.

Stock market candlestick financial growth chart.
Modern background design with abstract graphs and textures. Fully editable vector.
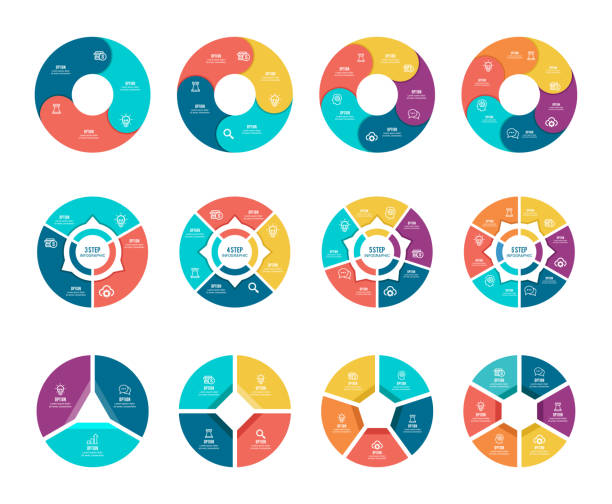
Vector illustration of the infographic elements, circle diagram.
30 Chart and Diagram Outline Icons.


Digital analytics data visualization, financial schedule, monitor screen in perspective for presentations
Big set of infographic tools. Use in presentation templates, mobile app and corporate report. Dashboard UI with big data visualization.

Modern table layout template with highlighted row. Flat design, easy to use for your website or presentation.

Simple set of diagram and graphs related vector icons for your design.

A financial data analysis graph. Selective focus. Horizontal composition with copy space.
Vector Icons - Adjust stroke weight - Expand to any size - Change to any colour